Description
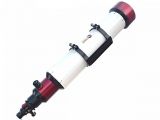
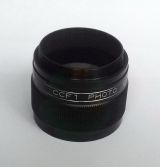
SBIG’s new ST-i spectrograph was designed specifically for our ST-i camera. This unit is intended to enable an amateur to characterize his/her skies, flat field sources, filter passbands, and other light sources. Its main purpose is to allow an amateur to measure his sky spectrum, and optimize his flat field sources to better match his conditions. The reason why this is important can be found in an article by Alan Holmes titled Flat Fields – The Ugly Truth found here: http://www.sbig.com/about-us/blog/flat-fields-the-ugly-truth/ This unit also provides a good way for an amateur to compare his light pollution situation to users at other sites.
The design is simple: light enters the spectrograph through a 25 micron entrance slit and is collimated by an achromatic lens. It then passes through the Schott SF11 glass prism, where blue light is bent through a greater angle than red wavelengths. A second achromat focuses the light onto the CCD, with an additional plano-convex lens to shorten the focal length and increase the photographic speed of the system to F/3.66. The speed is important when trying to capture the sky background. The plane of the CCD is actually tilted a little bit relative to the angle of incidence of the light to reduce the contribution of chromatic aberration to the optical blur.
The spectrum of a neon gas discharge tube captured with this system is shown in below.
Note that the spectral lines are straight, top to bottom, even though the slit is seen to be curved when inspected visually. The slit curvature was added to correct the natural tendency of the off axis rays from the slit being bent by a slightly lesser amount by the prism than on-axis rays. Curving the slit straightens out the lines, enabling greater vertical binning of the CCD for faint targets. In these figures, blue wavelengths are on the left, and red on the right.
The next figure illustrates the sky background from a Santa Barbara backyard, which has about 5th magnitude skies.
To capture this, the spectrograph is simply pointed straight up. As a result, background starlight is also included in this spectrum and is visible as the semi-uniform continuum baseline. The resolution around the natural airglow line at 557.7 nm (marked) is adequate to separate it from the pervasive mercury line at 540.6 nm, and the sodium line at 568.8 nm (both from streetlights).
Two other examples, shown below, used in the instruction manual for alignment include fluorescent light with a bright line at 5461 Angstroms and daylight with a dark absorption line at 7650 Angstroms:
A program for a PC is included with the spectrograph that allows the user to control the ST-i and acquire spectra, to create a wavelength calibration for the spectrograph, output text files of the data for processing with Excel or another program, and re-bin the data into a format with uniform sized wavelength bins for simpler comparison with grating data or from other sources.
--------------------------------------------------------------------------------
The ST-i Spectrograph is available separately or bundled with the ST-i camera.
Poznámka: cena je uvedena bez ceny dopravy při dovozu.
